

Market
Market
Parry Sound Cottage Market Q3 2026: Sales Jump 42%
Q3 2026 Market Report
The Parry Sound Cottage Market, By the Numbers
Q3 is in, and it reads differently than Muskoka's. Sales are up 42 percent from a year ago, the strongest quarter this market has posted in years. Terminated listings are still running at nearly six times the historical norm. Here is what the data actually shows.
Q3 2026 vs Q3 2025 / At a glance
Cottage sales
Months of inventory
New listings
Avg. sale to list price
Terminated listings
Active listings
Q3 2026 vs Q3 2025 figures cover detached waterfront cottages, multiple real estate boards (see the note at the end of this report). July 2026 is confirmed; August and September are estimated by applying the average year‑over‑year change from May through July to last year's totals. 8‑yr averages use 2018–2025.
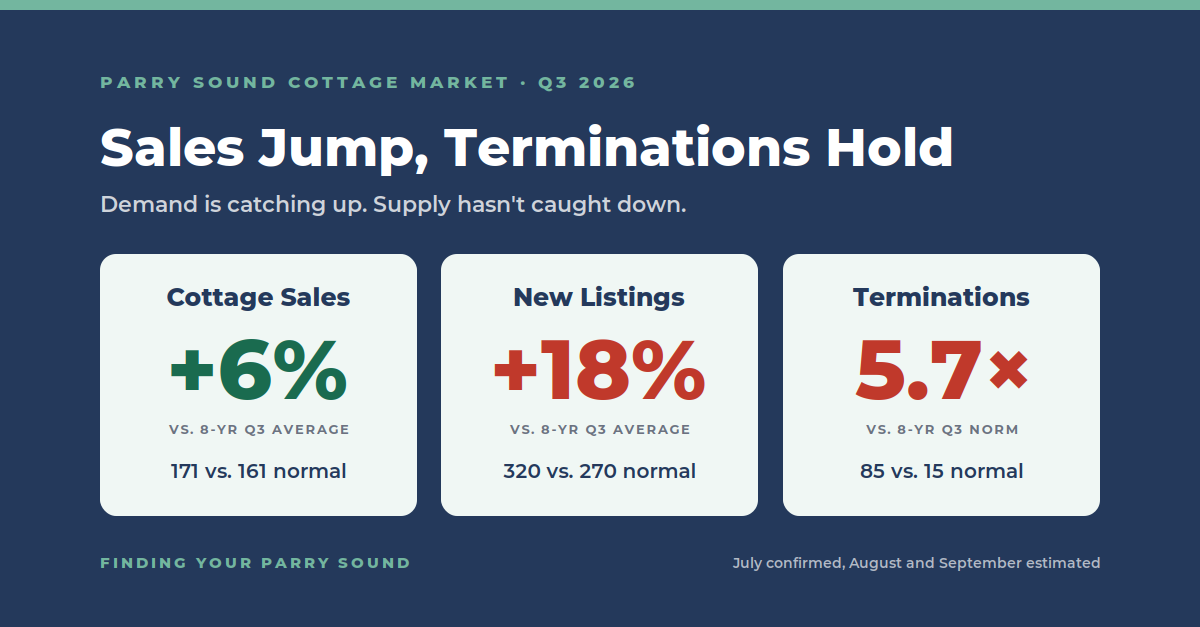
171 detached waterfront cottages sold across multiple real estate boards in Q3 2026, up 42 percent from Q3 2025's 120 and 6 percent above the 8‑year Q3 average of 161. That is a genuinely different quarter than Muskoka just had: sales accelerating rather than easing, inventory improving rather than building. Terminated listings tell a less comfortable story, still running at nearly six times the historical Q3 norm even as sales pick up.
Both things are true at once. Buyers are closing more deals than they were a year ago, and months of inventory has eased from Q2's 9.1 down to 6.3. But the termination rate that spiked in 2025 hasn't come back down, it has just stopped climbing. That reads like a market finding a new, higher baseline for how often sellers walk away, not one working through a temporary backlog.
The Quarter
Sales accelerated. That's the headline this quarter.
Q3 2026 closed at 171 cottage sales across multiple real estate boards, in all price ranges. July is confirmed at 59. August and September are estimated from the year-over-year trend in May through July, since board data for the current quarter is still being finalized; we'll swap in the confirmed totals once they're published.
Q3 cottage sales, 2025 to 2026
Full third quarter (July, August and September), vs. the 8-year Q3 average · multiple real estate boards, detached waterfront
July confirmed; August and September figures, see methodology below. Source: MLS® board data, detached Parry Sound waterfront cottages, multiple real estate boards.
120 sales in Q3 2025 was itself a modest number by this market's recent history. 171 this year is a real jump, not just a low bar cleared: it is also 6 percent above the 8‑year Q3 average, the first time in several quarters this market has read above its own long‑term norm rather than below it.
Eight Years Out
Eight years of context: a market still resetting, not stabilising
A single quarter doesn't tell you much without a longer frame. Here are annual cottage sales since 2018, the earliest year with complete multi-board coverage.
Annual cottage sales, 2018 to 2025
Compared against the 8‑year average · 2026 is excluded (partial year)
Navy bars without outline are 2018 and 2019, the pre-pandemic baseline. Source: MLS® board data, detached Parry Sound waterfront cottages, multiple real estate boards, 2018 through 2025.
Unlike Muskoka, Parry Sound hasn't settled into a clean post-pandemic band. 2022 opened the correction at 323 sales, then activity kept drifting down through 2023's 257, bounced partway back to 299 in 2024, and slipped again to 276 in 2025. The 8‑year average of 402 sits above every one of those four years, a sign that "normal" here may be resetting lower rather than just correcting back toward an old baseline.
Our trailing twelve months, October 2025 through September 2026, sits at 343, up from 273 in the prior twelve months, a 26 percent gain and the clearest sign yet that sales have turned a corner within that lower band, even if the band itself hasn't returned to its historical average.
The Supply Story
Sales are up. Terminations haven't followed.
Sales accelerating is the encouraging part of this report. Inventory easing is the second piece of it. Terminations refusing to come back down is the third, and it's the one worth watching most closely.
Terminated cottage listings: 12‑month rolling average
January 2018 through September 2026 · multiple real estate boards, detached waterfront
Scroll to explore →
August and September 2026 estimated by applying the average year-over-year change from May through July to last year's totals. Source: MLS® board data, detached Parry Sound waterfront cottages, multiple real estate boards, January 2018 through September 2026.
183 cottage listings were terminated in Parry Sound in 2025, against a 2018–2024 average in the low teens. Q3 2026 came in at 85, barely different from Q3 2025's 84, and year to date the two years are effectively tied at 154 versus 155. That's not acceleration, but it isn't relief either: the trailing 12‑month average has flattened out at roughly 15 per month rather than continuing to climb, a new plateau nearly six times the pre‑2025 historical norm rather than a retreat toward it.
Put together, this is a market where demand caught up faster than supply eased. Buyers are absorbing more of what comes to market than they were last quarter. Sellers who overpriced during 2025's spike are still walking away in about the same numbers as a year ago, not more, not fewer.
On Price
A narrower gap between average and median
The Q3 average sale price was approximately $944,000. The Q3 median was $863,000, a gap of about $80,000, far narrower than Muskoka's, reflecting a market with fewer ultra‑high‑end outliers pulling the average away from the middle. A handful of sales did clear $3 million this quarter, at least three that we can confirm through OnePoint's own records, though we don't have a reliable year‑ago figure for this price band specifically, so we aren't calling a trend on it.
The median was up 17 percent from Q3 2025's $737,000, a real gain. The average moved the other way, down 5 percent from $996,000, which given how narrow the average‑median gap is here likely reflects fewer higher‑end closings this quarter rather than broad price softening. Sale to list ratio was 93.6 percent, essentially flat from Q3 2025's 93.8 and about 3 points below the 8‑year norm. Sellers are giving up a little more room than the historical average, consistent with a market still working through elevated inventory even as absorption improves.
What This Means
What this means right now
If you are buying
This market is moving faster than Muskoka's right now. Inventory is still elevated relative to history, but it is shrinking quarter over quarter, and a meaningful share of listings are still terminating rather than selling, so there is still room to negotiate on the right property. That room may not last as long if the current pace of sales continues.
If you are selling
Sales are up, but the termination rate hasn't moved. Sellers pricing to where the market was in 2025 or early 2026 are still ending up in that termination count. Pricing to today's demand, which is stronger than it was a year ago, is what's actually converting right now.
Questions on any of this? Give us a call.
Contact Us