Market
Market
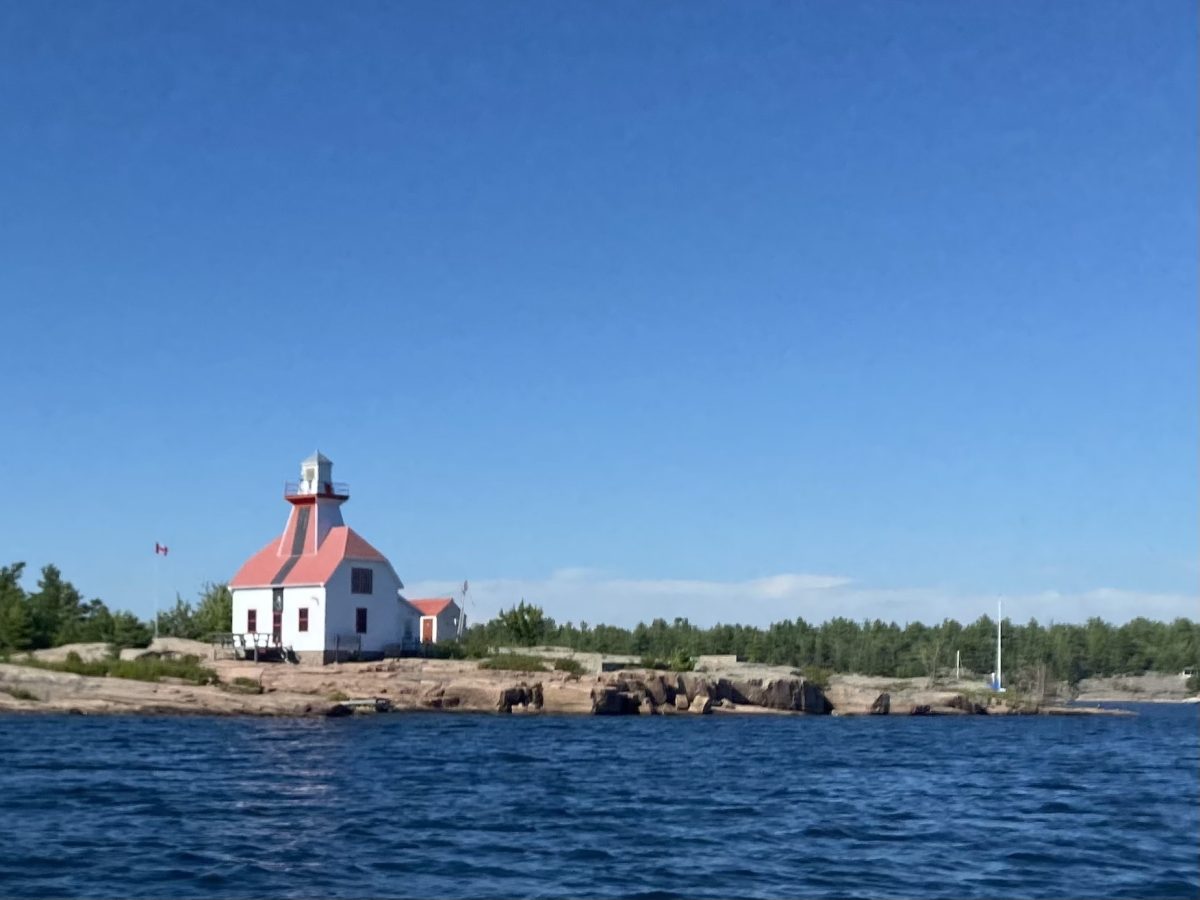
Parry Sound Cottage Market | Year End Review & 2026 Outlook
2025 Review
2025 proved to be another difficult year for the Parry Sound cottage market. Sales edged higher, increasing 2.5% from 2024 to 373 transactions, but still ran approximately 31% below long-term historical norms. Weakness was evident across all price ranges. Even the luxury waterfront segment—properties priced above $2,000,000—saw sales decline by roughly 10% year over year, underscoring the depth of the slowdown. A very interesting statistic is that on average, cottages sold for 93.5% of asking even with a large number of price drops. I see this as evidence that sellers expectations are still substantially higher than the market will currently bare.
Listing activity continued to build. New cottage listings rose 3.4% year over year to 1,179 units, pushing overall supply close to decade-high levels. Inventory was elevated across every price band, creating sustained pressure on absorption. If we pull back even further however, the listing numbers are much closer to long term averages.
One of the most notable features of the year was the surge in terminated listings. Termination volume—properties withdrawn from the market without a successful sale—reached 247 units, the highest level in recent memory and more than four times long-term historical norms. This reflects widespread repricing activity and growing seller resistance in a price-sensitive market.
2025 in a Nutshell
- Unit sales down 5.7% - 31% below long term averages
- Sale prices averaged 6.5% below asking
- New listings close to 10 year high
- Termination rate at historic highs
- Average days on market was 61, down from 64 in 2024
- Average Price - $ 911,813.00, down 11.2% from 2024
- 11.8 months of inventory on average with 15.75 at the end of December
2026 Outlook
Looking ahead to 2026, we expect conditions in the Parry Sound cottage market to remain largely unchanged from 2025.
Supply is likely to remain elevated. Many cottages that failed to sell heading into last fall remain on the sidelines. When combined with new spring listings, inventory should stay high well into the third quarter. We expect total waterfront listings to rise modestly, likely ending the year approximately 10% higher than last year.
Demand remains subdued, with persistent buyer hesitation continuing to define market conditions. As discussed in our 2025 outlook, multiple headwinds have converged—and in some cases intensified—over the past year, reinforcing cautious sentiment and extending decision-making timelines. The most consequential of these challenges is ongoing trade uncertainty with the U.S., the influence of which cannot be overstated.
Short-term rental regulation is becoming an increasingly important factor. More municipalities are introducing licensing systems with tighter restrictions, and in some cases outright bans. These changes are reshaping demand, particularly for properties that relied on rental income to support pricing.
The Non-Resident Speculation Tax (NRST) continues to influence activity across all price points, though its impact is most pronounced in the luxury segment, where discretionary and cross-border buyers have historically played a larger role.
Consumer confidence remains a significant drag. Ongoing economic uncertainty, combined with U.S.–Canada trade tensions and tariff risk, continues to reinforce a cautious, wait-and-see approach among buyers.
Pricing pressure is expected to persist. We anticipate prices will soften an additional 5–10%, which would effectively return cottage values to approximately 2020–2021 levels.
Chart shows annual waterfront cottage sales in Parry Sound District. Data reflects MLS®-reported waterfront transactions only and excludes non-waterfront properties & private / exclusive sales.
MLS® Data Source - Multiple Real Estate Boards | Habistat Analytics
Chart shows percentage waterfront price changes in Parry Sound District. Data reflects MLS®-reported waterfront transactions only and excludes non-waterfront properties & private / exclusive sales. Data Source - Multiple Real Estate Boards | Habistat Analytics
Parry Sound Real Estate: Where is the Market Heading?
Most real estate reports look backward at sold data. We prefer to look forward. We have built the Ontario Cottage Market Forecaster™, a predictive tool that uses 10 years of historic data and tracks 12 real-time economic signals—from interest rate sensitivity to luxury inventory absorption on the Bay—to project market movement.
See the Parry Sound ForecastFinally
We produce multiple market reports and publish a lot of charts and statistics to support our commentary. The downside is that the information overload can start to feel overwhelming. To simplify things, we’ve distilled the market into one straightforward example.
The chart below illustrates how the value of a typical Parry Sound waterfront property purchased for $400,000 in 2010 would have moved over time, based on actual year-to-year changes in median sale prices across the Parry Sound waterfront market.
This is a market-wide benchmark and not a reflection of any single waterbody (for example, Lake Manitouwabing or Georgian Bay). Its purpose is to show the broader trajectory of the waterfront cottage market and how pricing dynamics have evolved through different cycles.
For additional context, you can toggle on comparisons for Parry Sound, Muskoka, Haliburton, or the Ontario waterfront market overall.
• Values are indexed to a $400,000 cottage purchased in 2010, based on median sale price movements.
• Each line shows a 12-month rolling average of the indexed value to smooth month-to-month variation.
• “Waterfront” includes all waterfront property types where applicable (not cottage-only).
• The shaded band (2020–2022) highlights the pandemic period.
• The shaded band (2026) applies an illustrative –10% adjustment spread evenly through 2026 (rolling projection).
For readers actively considering a purchase, current Parry Sound cottages for sale can be explored here, while the analysis above provides longer-term market context.